|
|
|
You can get e-magazine links on WhatsApp. Click here
|
|
|
|
|
|
Smart use of state diagram for determining food stability during processing and storage
|
|
Monday, 29 February, 2016, 08 : 00 AM [IST]
|
|
Mohammad Shafiur Rahman
|
|
fiogf49gjkf0d Foods undergo many physicochemical changes during their processing and storage. It is important to understand their mechanisms and kinetics in order to attain desired quality attributes and to avoid undesired consequences. In order to determine the food stability, two questions need to be asked: what target attribute(s) needs to be achieved in the microbial, chemical, bio-chemical and physical changes; and what is the required time frame of stability? When considering stability, the microbial and chemical safety aspects must be considered first before sensory properties. These are the main important factors need to be envisioned for selecting preservation method(s). The stability guidelines are mainly based on the pH, water activity and thermal processing. FDA’s Good Manufacturing Practice Regulations governing the processing requirements and the classification of foods are shown in Figure 1.
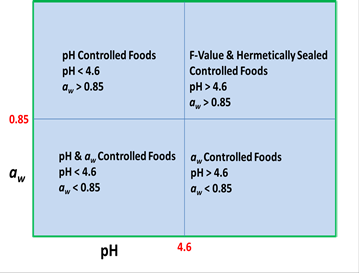
Figure 1. FDA Good Manufacturing Practice Regulations governing processing requirements and classification of foods
Low acid (i.e. high pH) foods packaged in hermetically sealed containers must achieve commercial sterility conditions either by retorting or combined treatment of pasteurisation and water activity or a combined treatment of pasteurisation and acidification. It could be seen that pH 4.6 and aw 0.85 are the critical limits. In 1962, the US Public Health Service in the “Food Service Sanitation Manual” issued the potentially hazardous food (PHF) as any perishable food which consists in whole or in part of milk products, eggs, meat, poultry, fish or other ingredients capable of supporting the rapid and progressive growth of infectious or toxigenic microorganisms. The progress of the definition of PHF is discussed in the IFT/FDA Report (IFT/FDA, 2003). FDA Food Code in 1999 defined PHF food as it must be kept cold or hot, because the food (i.e. temperature controlled for safety, TCS) has the necessary intrinsic factors to support the growth of pathogens. The TCS foods require time/temperature control to limit pathogen growth or toxin formation that constitutes a threat to public health. A science-based framework based on the above factors was proposed by the IFT/FDA panel (IFT/FDA Report, 2003).
Food spoilage and stability determination from a scientific basis rather than empiricism is a challenge to food scientists and engineers. Over the years, F-value (i.e. parameter to determine severity of heat treatment) water activity (i.e. state of water) and glass transition (i.e. matrix molecular mobility or diffusion) concepts are the three most successful theoretical foundations developed in determining the food stability. In the 1950s, scientists began to discover the existence of a relationship between the water contained in food and its relative tendency to spoil. Australian scientist W J Scott observed that the active water could be much more important to the stability of food than the total amount of water present and it is possible to develop generalised rules or limits for the stability of foods using water activity concept. For example, there is a critical water activity below which no microorganisms can grow, this value is about 0.6. most of the pathogenic bacteria cannot grow below a water activity of 0.85; whereas most yeasts and moulds are more tolerant to reduced water activity but usually no growth occurs below a water activity of about 0.6. In the 1980s, a number of limitations of water activity concept were identified and the glass transition concept was proposed.
In 1966, G W White and S H Cakebread highlighted the importance of glassy state of foods in determining its stability. A low glass transition food means that at room or mouth temperature, food is soft and relatively plastic, and at higher temperature it may even flow. In contrast, a food with high glass transition temperature is hard and brittle at room temperature. Inertness is the most important characteristic of glass, thus if we transform a food into glassy state then it would be more inert and stable without any deterioration. The significant applications of the glass transition concept emerged in food preservation and processing in the 1980s, when H Levine and S Slade identified its major merits and wide applications. They proposed a state diagram based on glass transition. A state diagram is a stability map, which shows different states and phases of a food as a function of water or solids content and temperature. It assists in determining stability of foods during storage as well as selecting a suitable condition of temperature and moisture content for processing. The proposed state diagram based on glass transition presented 4 macro-regions in determining food stability. A combination of two concepts (i.e. water activity and state diagram based on glass transition) could be a powerful tool in determining food stability. M S Rahman first combined these two concepts in the state diagram plotting BET-monolayer water (i.e. strongly bound water) in the state diagram. He extended this concept further to develop macro-micro regions concept in the state diagram (Figure 2).
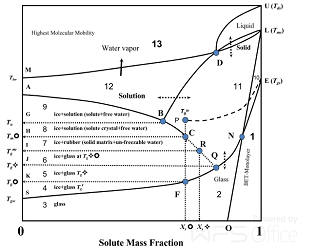
Figure 2. State diagram showing different regions and state of foods (updated from Rahman, 2006) (Rahman, 2009) Tds: solids-decomposition temperature, Tms: solids melting temperature, Tgs: solids–glass transition temperature, Tgiv: end of solids-plasticization temperature, Tgw: glass transition of water, Tu (solute crystallization temperature during freeze-concentration), Tm (maximal-freeze-concentration condition, i.e. end point of freezing), Tg (glass transition of the solids matrix in the frozen sample as determined by Differential Scanning Calorimetry (DSC)), Tg (intersection of the freezing curve to the glass line by maintaining the similar curvature of the freezing curve), and Tg (glass transition at maximal-freeze-concentration, i.e. at the end point of freezing), Tbw: boiling temperature of water (Source: Journal of Food Engineering).
He hypothesised 13 micro-regions in the state diagram having highest to the lowest stability based on the location from the glass and BET-monolayer. The advantages of the micro-region are (i) stability rules could be developed for each micro-region (i.e. narrow moisture and temperature) as compared to the macro-region (i.e. broad moisture and temperature region), (ii) the states or phases of foods could be identified in each micro-region, and (iii) a reference point could be identified where BET-monolayer line and glass line intersect and any location in the state diagram could be assessed in relation to the reference point. In addition, it would be easy to develop stability rules as well as important hurdles need to be used in each micro-region when multi-hurdles of preservation are used.
The developed state diagram is now being used in determining food stability during storage as a function of temperature and moisture content. It has also applied in optimising or selecting processing path of drying, freezing, baking and crystallisation processes. An example is presented here to show the dynamics of the drying process in the state diagram (Figure 3).
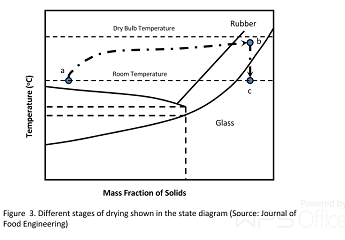
Figure 3. Different stages of drying shown in the state diagram
Point a in the figure represents fresh foods with high moisture at room temperature. The sample temperature is increased to wet bulb temperature and the moisture is decreased and sample is reached at point, for example b as rubbery state. After cooling, the dried sample reached to the glassy state at point c and it becomes stable.
Food industry could be significantly benefited by using state diagram for designing their process for achieving desired characteristics and their stability during storage. Smart use of the diagram could avoid food wastage by reducing their spoilage during processing, storage and distribution. The author’s group is now conducting number of experiments for further progress of the macro-micro region concept and to determine its wide validity and applications in food preservation and processing. The author would like to acknowledge the support of Sultan Qaboos University for his research in the area of food preservation and processing.
(The writer is professor, department of food science and nutrition, College of Agricultural and Marine Sciences, Sultan Qaboos University, Muscat. He can be contacted at shafiur@squ.edu.om)
|
|
|
|
|
|
|
|
|
|