|
|
|
You can get e-magazine links on WhatsApp. Click here
|
|
|
|
|
|
Measurements...A secret to Loss Management in Dairy Industry
|
|
Monday, 17 August, 2015, 08 : 00 AM [IST]
|
|
Sham Chaudhry
|
|
fiogf49gjkf0d In his seminal work, Out of the Crisis, 1982, pp 507, the quality guru, Dr W Edwards Deming (1900-1993), said it clearly, “What cannot be measured, cannot be controlled.”
In my experience of some 50 years in dairy processing and quality control, I found this requirement missing to a great extent. As if to prove this point, practical work was initiated in two dairy plants, one small and one large, over 10 years. Measurements of several quality characteristics were made by way of Run Charts and 3 Sigma Control Charts.
Run Chart: A plot of values of a chosen quality characteristic over time. Example: Number of leaky milk pouches plotted daily over a month.
Control Chart: It is a Run Chart where in addition to the central line, Mean, the upper control limit, UCL, and lower control limit, LCL are also drawn. The UCL and LCL are values derived by multiplying the long-term (say three months) standard deviation figure of the selected characteristic, say the number of daily leaky pouches, by three and adding to or subtracting from the average or Mean Value.
As an example a case study may be quoted. In the small dairy, use of water per litre of milk processed was measured. Water consumption depends upon the product mix being handled, the number of Cleaning-In-Place circuits being done, the number of tankers, storage tanks, pipelines and other equipment being cleaned etc. More products than just liquid milk handling would require larger volumes of water to be pumped out from the ground for use; as also larger volumes of effluent required to be treated by the dairy plant.
At the beginning of the study, on an average 2.9 litre water was being used per litre milk processed. It was decided to be careful in the use of water and conserve as much water as we could. The dairy figures were reviewed every month and the department heads told to shave off water consumption further. As a result of review of monthly figures in the Business Review Meetings, water consumption came down from 2.9 to 2.3 litre milk handled in about five years. Not a mean achievement.
Water Meters
At this stage, one further intervention was made. Five good quality Water Meters were purchased and installed on water lines going into different product sections of the dairy. Daily consumption figures were recorded department-wise. The results were compiled and presented in the next monthly review meeting. The entire professional staff was in for a shock! The dairy's water consumption was read out. It was 1.7 litre milk handled, down from last month's 2.3. Water Meters achieved the same results in one month as coaxing of production staff did in five years.
There is no use labouring over the reasons for this breakthrough. Nobody can quarrel with measured values. The meters identified and pointed out precisely where water was being wasted. This was a lesson waiting to be learnt. In subsequent efforts, the production staff brought the figure down to 1.4 litre.
The above example may also be adapted or modified for measuring other quality characteristics.
Measuring other Quality Characteristics
1.Weight of various packed product packs.
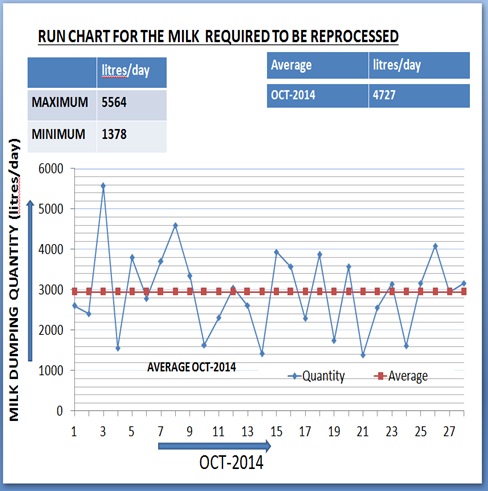
2.Volume of milk required to be reprocessed daily.
3.Consumption of Utilities:
- kWh /day for the dairy, different sections
- Milk processed/ cubic metre of Natural Gas
4.Estimation of Total Milk Solid Losses, for the Dairy, for different sections, daily/monthly.
5.Number of Motors burnt over the month.
6.Calculation of kg COD/day based on the COD value of raw (incoming) effluent and its volume.
7.Cost of transportation of raw milk.
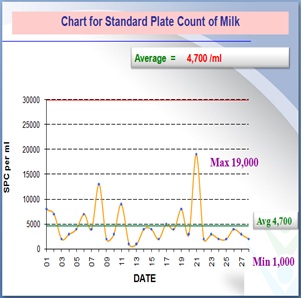
8.Standard Plate Counts (SPC) of Packed product; SPC of incoming Raw Milk.
9.Number of coliform free days/ month for ice cream, paneer.
10.Shelf life of milk under refrigeration.
In the example for water consumption for the large dairy the figure came down from 1.9 litre of water/litre milk handled to 0.9.
It may be concluded that introducing measurements of the type mentioned above will result in cutting down losses, a critical requirement to stay competitive in the market place, as also to get a handle on making continuous improvement, another requirement prescribed by Dr W E Deming.
(The author is former assistant general manager, quality, GCMMF [Amul], Anand)
|
|
|
|
|
|
|
|
|
|